Wednesday, June 15, 2011

Medieval 3D Construction Models

In 16th C Japan, the need for a new kind of construction drawing emerged with the proliferation of teahouse construction. These new documents were necessary because sanctions, based on the generational secrets of a rigid class-trade structure, meant mainstream Japanese architecture followed an empirically controlled system of building construction.

Classic Japanese Architecture
http://en.wikipedia.org/wiki/Japanese_architecture


Three-dimensional construction drawings
At the same time, variations in private teahouse construction created an opportunity for many builders. These structures required special attention to detail to satisfy owner expectations.


Hiroshi Sakaguchi, Master Carpenter’, Ki Arts


However, the demands of customization meant it was important to document both intent and process to elite owners in order to avoid the shame a poorly executed project would bring to the honor of its builder.

Okoshu-ezu
In response to the need for a detailed document to control the production process, Japanese master carpenters began using a construction drawing called an “okoshu-ezu.”
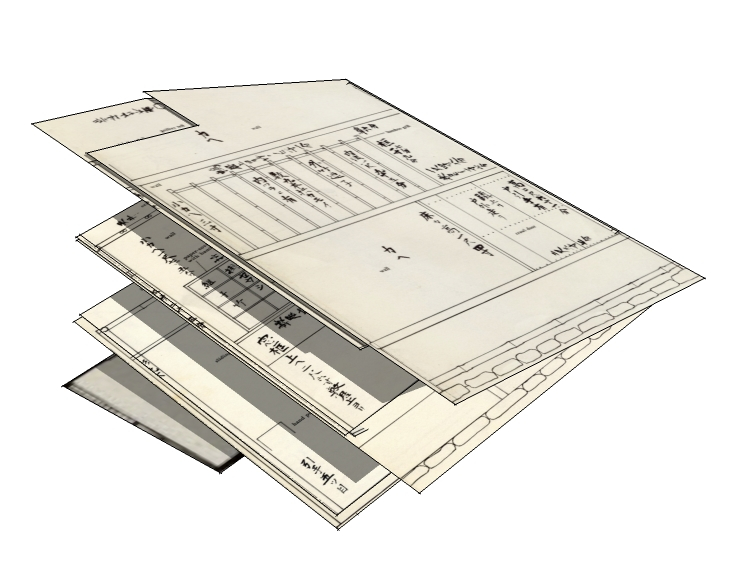

Pages scanned from "What is Japanese Architecture" (Amazon)
 
An okoshu-ezu is a folded drawing that can be opened into a three-dimensional construction model. Many were animated with pop-ups using origami techniques to explain special features in the construction. Specifications for alcoves, posts and lintels were written directly on the folded pages, with cut outs for steps, floors, and shutters glued onto the model’s surfaces.
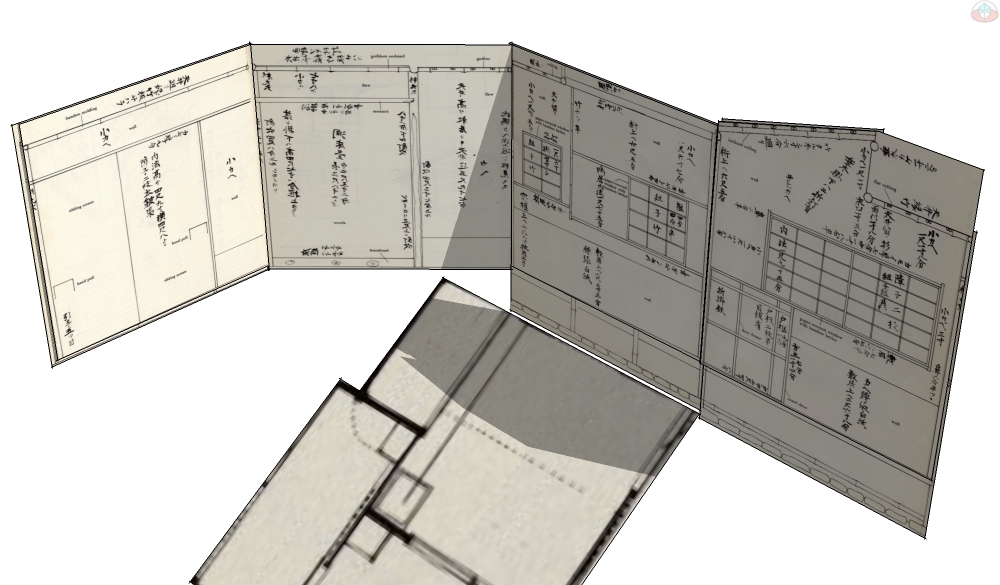

Pages scanned from "What is Japanese Architecture" (Amazon)

Instructions were drawn on both side of the folded paper so that shelves, alcoves, shojis, hardware, and wall finishes were visible in direct relationship to the opposite side of the wall. Penetrations like crawl doors and shoji screened openings were then seen from both the inside and the outside of a wall at the same time.

Three dimensional construction communication
Okoshu-ezu were drawn by scribes to layout and communicate the details of the construction for both craftsmen and influential owners. Important is that their purpose was not to visualize the design, but to communicate the requirements of the construction.

As such, they were carried by masterbuilders in the field along with a measuring stick and plumb-level. These were the tools of early construction managers.
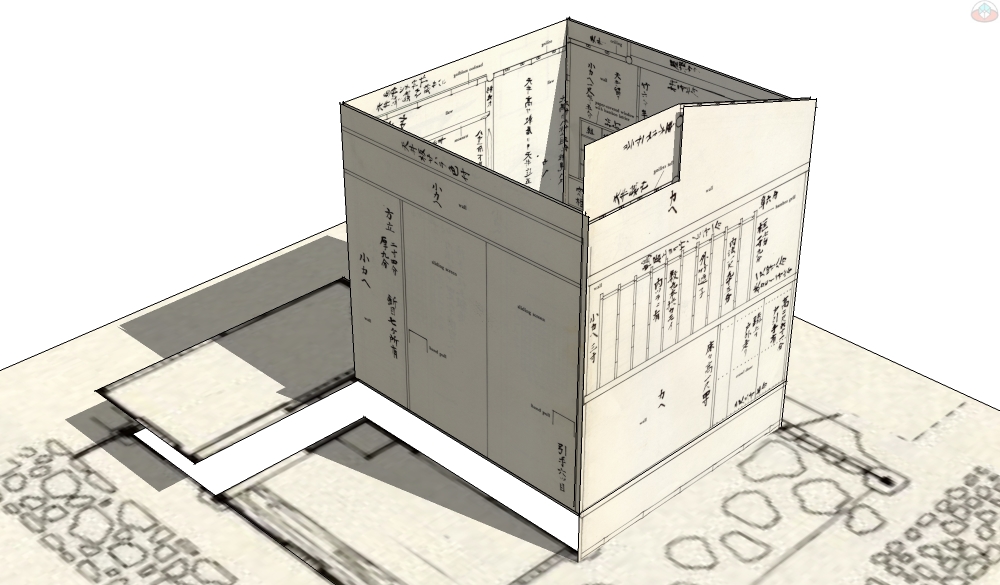

Pages scanned from "What is Japanese Architecture" (Amazon)

On the jobsite the drawings could be referenced as individual pages by viewing the folded pages. But the pages could also be unfolded into a three-dimensional form to contextualize a particular detail or special instructions.

Three dimensional construction information
In practice, an okoshu-ezu is not much different from the construction models used today. Assembled in three-dimensions by experienced builders, construction models lay flat in a file-pocket ready for access, viewable in two-dimensions using defined view points, and easily annotated with notes and links to contextualize the information in 3D.


http://insitebuilders.com

The only difference is how simple it has become to create a functional three-dimensional information model. Using simple 3D modelers like SketchUp and virtual construction methods like those found in books like “Mastering the Art of 3D Construction Modeling,” modern builders now have a dynamic and versatile tool to use in a new era of construction management.


.

Monday, May 23, 2011

The View from Flatland

Technologies like Twitter and Facebook are beginning to demonstrate the potential of social media for construction and construction management. This began with some construction companies promoting their services with photographs and marketing material, but has recently evolved into a new set of tools for construction management. Tools that add a social dimension to project-based information.
Insitebuilders: Facebook
What’s interesting is that this new dimension sets up a casual relationship between production teams and project owners as a “community” of mutual interests. The result is a computer mediated space where a stream of informal posts add a deeper understanding of the day to day challenges faced on the jobsite. For example, take a look at the website for Pentland Homes, Oehlberg Construction, and Lyons Sitework.
Insitebuilders: Oehlberg Homes
Though content differs for these companies, what comes across in the postings, comments, and “like-clicks” is a community of interests centered on not only a particular project, but the concerns of the company’s managers. In other words, what we see are the social values associated with their work. These are the same values that are usually buried by formal transactions commonly found in construction communications.

Flatland
Recognizing the value of these social associations to construction is a lot like seeing into the reality of the one and two-dimensional worlds described in the book, Flatland by Edwin Abbott, 1884.
Insitebuilders: Gutenberg.Org Flatland
In this book, women are lines while men are segmented polygons. However, when viewed along their one dimensional edges both line and polygon appear the same. It takes the invasion of a three-dimensional sphere to even suggest that there may be a dimension beyond the flattened world-view of a single dimension.

While the narrator in the book (a square) struggles to explain a second dimension where both line and polygon can be seen for what they are, it takes the invasion of a three-dimensional sphere into Flatland to expose the limits of their narrowly defined perceptive understandings. But even as the sphere clearly demonstrates the limitations of 2D by introducing the spatial superiority of 3D, the sphere refuses to consider the logical assumption that there must be yet another dimension beyond its own.

As a social commentary, Abbott goes beyond structured dimensional consciousness into a allegory on social order and class based prejudices. For construction communications, what he points to is the difficulty of changing immediate and long held perceptions of the way things ought-to-be, in order to recognize the potentials that come from new dimensional insights.

The 4D Doodler
In the same way, Ralph Waldeyer writes of the complexity of multidimensional experiences. In his book, The 4-D Doodler, 1941, he describes the confusions and misunderstandings that his characters experience as they slip in and out of a fourth dimension. As they are pulled in and out of the spatial warps of 4D, their understandings are clearly bound by the limits of their own three-dimensional experiences.
Insitebuilders: Gutenberg.org - The 4D Doodler
For them, 4D is something to be feared and avoided. Waldeyer describes how each one of his characters struggles in different ways to deal with being partially or wholly in and out of a different dimension. His lesson is that it’s quite possible for objects to exist in more than one dimension at the same time. Their only limitation is their inherent ability to deal with these multidimensional world views.

Push Pop Press
The ideas illustrated in these books show how dimensional change disrupts our response to new perceptions. This includes the challenges faced in simply recognizing the potential of these alternate dimensions. For example take a look at Mike Matas’ presentation at a recent TED conference on the next-generation digital book.
Insitebuilders: PushPop Press
Though the book is said to be the number one book on ITunes, in the end its really not much more than an imaginative interactive website viewed on an Iphone or Ipad. What’s important is that Matas points to the potential of a multidimensional communications tool that requires the same perceptual shift suggested in Flatland and The 4D Doodler.

For those locked in a traditional way of doing business, the very notion of another dimension remains somehow tightly held by higher, more mysterious powers. This means the transparencies of social media and the capacity of the web to deliver deeper levels of graphical information, raise both fear and frustration as new dimensions disrupt long standing traditions of construction management. Traditions that are rapidly changing in a new age of hypergraphic construction communications.
.
Monday, April 25, 2011

Design vs Construction Modeling

If you’re beginning to think SketchUp has some potential for construction management, you should take a look at the SketchUcation website.  The communities surrounding the user forums on this site are at the core of the SketchUp community and one of the most important resources for construction modeling.

SketchUcation

You can click around the forums and tutorials before you join, but to search topics for help or to download components and plug-ins, you need to register to participate and post.

SketchUcation Forums

Once inside the forums and links, you’ll find every possible SketchUp resource as well as answers to (almost) any questions you might have about SketchUp.  The SketchUcation forums and content make this website an essential modeling resource.

One thing that becomes almost immediately clear is that the SketchUcation website is dominated by designers, which means most of the model exchanges and discussions center around what makes the program work as a colorful and photo-realistic predesign tool.

SketchUcation Gallery

You’ll also quickly discover that design-oriented users, by Google strategy or neglect, pretty much define the modeling program.  This includes a development team with limited industry experience that drives the program to become even more narrowly focused as a design tool.  In other words, you won’t find a lot about process, production, or construction modeling unless you dig deep into the SketchUcation forums.

Design is color and style

At the same time, no where is the contrast between construction and design more clearly demonstrated than on the pages of the CatchUp – SketchUcation Community News where we’ve recently started the first in a series of articles on construction modeling.

An interesting thing occurred with the second issue of their online magazine.  As you flip through the pages of the e-magazine, the layouts and the quality of the graphic design are really impressive.  But look at the last page and the first part of a long (long) series of short tutorials on how to build a little house as a SketchUp construction model.

The juxtaposition of our unembellished, black and white format and the stylistic and design oriented images in the rest of the magazine, brings the difference between construction and design modeling clearly into focus.

CatchUp Newsletter: Construction Modeling

Production and process

The contrast in the look and feel of these pages illustrates the difference between design and construction modeling.  Like many outside of design, only a few construction managers care about color and style, except how it might be specified in the construction documents.  Instead most want to communicate intent or process and the cold hard facts associated with getting a building built.

In this way, the contrast is a graphic representation of two different worlds.  One uses models to introduce or sell a design product with color and imaginative style.  While the other uses three-dimensional models to visually manage the materials, labor, equipment and tools necessary to produce that product.

ConXtech Model

Construction models are built to communicate construction and not design.  The emphasis is therefore on models that can be quickly staged, annotated, emailed, posted, exported, printed, or faxed in minutes by anyone as fast, simple explanations.  The models are used to generate graphic explanations, visually simple, black and white, with the focus on process and production.

Simple, fast, and repetitive assemblies

This means construction models are faster to generate than design models.  As such, they are assemblies, nested and organized by the SketchUp Outliner, and based on a library of prefabricated pieces saved from all previous constructions.

Building SIMPLE: Insitebuilders

The model combines a scaled site setup and wire frames as component rigs on which to align and join previously fabricated pieces and subassemblies.  When these pieces are saved from models of the same building type, almost anything can be quickly reassembled from what is basically a proprietary kit of parts.  The only skill that is really required is to actually understand how the building is put together.

For construction communications, the completed assembly represents the process embedded in the result.  This is not a static picture of a construction.  The SketchUp Outliner, layers, and scenes are therefore used to control sequence illustrations or animations in order to dynamically communicate particular details or problems, test preconstruction assumptions, and simulate activities in order to analyze specific concerns.

ConXtech Tower: Insitebuilders

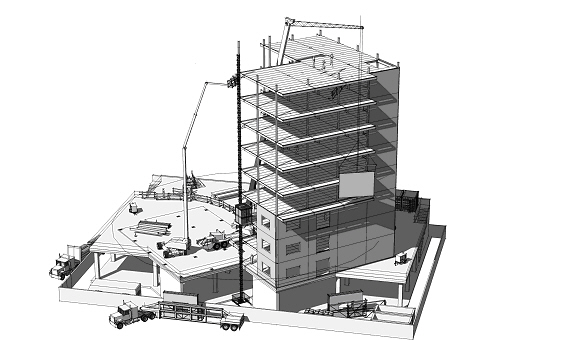
The result looks nothing like a design model.  Images extracted from the model are visual explanations, generated on-the-fly, delivered as illustrated contractual documents, representing nothing more that what is necessary to communicate a production process.

.

Saturday, March 26, 2011

Visual Construction Management

I used to remind my students that the biggest mistake they can make as a construction manager is to formally submit a problem or question from the jobsite without having any idea about what to do for a solution. As such, their question remains open-ended, and more importantly, the answer to the problem waits for the unexpected.

Leading questions
Construction managers should control the process. And just like the carefully practiced “closing statements” sales people are trained to use in product pitches, the only way to seal a deal and keep things moving along is to ask definitive and leading questions. Preferably with a yes or no answer.


Insitebuilders-ChangingMindsSalePitches        Insitebuilders-LeadingWithQuestions

For old timers, this was tough. Few had time to sit down and type out a detailed description of the problem, let alone think about offering a solution. And even fewer could support their submittals with drawings and estimates to illustrate the best possible direction.

Instead, most construction managers were forced to “work around” the problem while they waited for further instructions – often disrupting the schedule, adding to potential delays and overruns, while control drifted away from construction managers to others who may be less familiar with conditions on the jobsite.

Insitebuilders-VisualizeConstructionProblems


Visual explanations
Of course, the best way to keep a project on schedule is to know exactly how you plan to maintain its paths and dependencies. That requires practical explanations and detailed directions. And the best way to clearly explain a solution to a problem is with an illustration. After all, most solutions eventually return to the jobsite as a detailed drawing anyway.

At the same time, only a few construction managers are trained to draft or draw. And even when they are, as in one of my graphic communications classes, only a handful are really interested in perfecting their “artistic” techniques.

Automated drawings
But now, with free and simple modeling programs like Google SketchUp, construction managers are able to use 3D models to illustrate their own ideas. For them, it’s easier to build than to draw and there’s something about putting pieces together to build a drawing, even in a virtualized 3D world, that speaks to many contemporary constructors.

Insitebuilders-SketchUpVsRevit

And as it turns out, even architects and engineers use 3D models to draft their drawings. Designers now extract plans, sections, and details from three-dimensional building information models (BIMs). This means where 2D CAD programs once replaced hand-drafting, we now see these BIM models replacing computer drafting.

2D from 3D
BIMs are not as simple as they’re sold, but they are changing the way 2D drawings are produced. Gone are the days when it took a great deal of skill to meticulously craft a 2D drawing. Instead, designers now struggle with obscure codes and menu selections to generate complicated layers of information that go well beyond simple explanations, way too much trouble for most constructors.

Instead, with easy to learn 3D modelers like Google SketchUp, multiple solutions and detailed illustrations can be quickly assembled and exported as scenes from a simple construction model.

Insitebuilders-BonnieRoskesLayout3 Insitebuilders-BonnieRoskesLayout3

For example, Bonnie Roskes’ updated book combines Google Sketchup with Layout 3 to show how 3D models can be quickly converted into two-dimensional illustrations.

Though the content of Bonnie’s book goes well beyond extracting drawings, the method is almost exactly the same as taking a photograph on a virtual jobsite and attaching the image to the submittal with a paper clip.
  1. Start by building the 3D model,
  2. Use camera tools to position a point of view,
  3. Click to export the image for annotation
  4. Print or cut and paste the result.

Leading illustrations

This means anyone, even a hands-on-died-in-the-wool contractor can quickly illustrate any number of ideas and present them as suggested solutions in support of a leading question.

Even more important is that construction models used to stage these illustrations are piece-based assemblies of the suggested solution. The model therefore represents an embedded process. It can be deconstructed, reconstructed, and even animated to simulate the operational conditions that can lead the project team to a timely solution.

Insitebuilders-ValueEngineering


After all, even a rejected solution is a management tool. As value engineers from many different industries remind us, in a “systematic and structured functional analysis, rejected ideas generate alternatives and new directions.” It’s called brainstorming.

Visual construction management
In the end, visually supported explanations support a higher and more proactive level of competitive construction management. Where once a manager might avoid taking this level of control of their projects, many are beginning to understand that with an open and transparent communications based economy, they can bring definitive technical insight and expertise to a team of like-minded project professionals.

Insitebuilders-Visual Construction Management

And their message becomes especially powerful when they can represent their ideas with graphical skills that were once reserved for designers. A new generation of constructors now manage their projects with clearly illustrated leading questions that best serve their commitment to maintaining control of the project schedule.

.

Wednesday, March 2, 2011

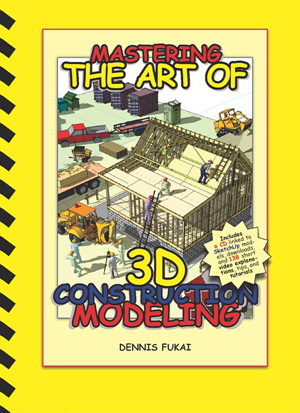
Mastering the Art of 3D Construction Modeling

.
We just finished an update to our classic book, 3D Construction Modeling. 
www.insitebuilders.com

The new book was written for project managers who want to learn first hand how to build their own piece based construction models.  A construction model is a process model, built to communicate ideas and illustrate details using a deconstructable assembly of accurately scaled groups and components. 


In other words, a construction model is specifically built to be assembled, disassembled, and staged to communicate the means and methods of a construction.  As such, it is not a design tool, it is a communications tool.

So simple a child can do it 
The key to fast and simple construction modeling is an open-source 3D program like Google SketchUp.  As advertised, the software is so easy that a child can use it.  And though that’s a true statement, most of us know that doesn’t necessarily mean it’ll be easy for a project manager to learn to use the program in the real-world of construction. 

http://sketchup.google.com/

But all it really takes to master the art of construction modeling are a few tips and tricks, a little practice, and the motivation to put the program to work. 

That’s the objective of this book:
  1. Pass on tips and tricks collected over almost a decade of construction modeling
  2. Animate the modeling process with a series of short video tutorials
  3. Demonstrate what models can do for professional construction communication

Graphical indexes
The book blends annotated illustrations, short videos, models, and tips and tricks into a series of graphical indexes.  


First as a content page that looks a lot like a standard work breakdown structure (WBS) with eight construction phases.


The WBS thumbnails link to a series of video indexes on the book’s CD and are included in the book’s table of contents as an overview of each chapter.  These chapter indexes link to a series of 74 short video explanations of the virtual construction.


The chapters themselves include 54 quick tips and tricks to support the video tutorials.  The tips and tricks are simple techniques that help to speed model construction. 


.
The pages of the book act as a graphical index of the tutorials.  As such they illustrate the content of each of the video tutorials, introducing techniques that may already be understood, leaving the user to decide the relevance of each step in the modeling method and the corresponding tutorial, based on their experience with the program.


The video pages linked from the graphical index on the book’s CD include embedded YouTube links and full size Flash animations that cover the details of the printed illustrations.  We include these videos on the CD as pop-ups along with resources and cross references to the programs, tutorials, checklists, models, and files used for each phase of the construction model.


.

The book’s CD also includes all the models used to illustrate the book, plus the Insitebuilders Shortcuts data file, Insitebuilders Template file, and 154 components taken from the much larger Insitebuilders Component Library.  The rest of our collection can be found in the models included with our other books (Building SIMPLE, Being SUSTAINABLE, How a House is Built, and How to Plan, Permit, and Pay for a Small Home of Your Own).


Components are an important part of fast-track construction modeling.  No piece of a construction model needs to be built or supply-sourced more than once.  Just like the real world, each model draws on the experience and resources that worked on a previous project and every new construction begins with a collection of components that have been built before.


This means a construction model is no more than a quick assembly from a known collection of prefabricated parts.  The tutorials in this book demonstrate this collective method of modeling using a combination of a fast fabrication technique to build and update new components. 

This includes a detailed look at the Outliner and how it keeps the pieces of the model organized, making it possible to stage illustrations, organize deconstructions, and animate sequences of production.  The Outliner also formats components so that they can be quantified and linked to cloud sourced documents like spreadsheets, slide presentations, and reports.  

At the center of a cloud
The book therefore mixes digitally printed illustrations and annotated graphics captured from SketchUp, video explanations and sample models, along with YouTube and Flash videos, pop-ups, web pages, checklists, spreadsheets, slide shows, and text based PDFs.  
www.SourceForge.net


Most important, the entire book was produced using a combination of open-source and freely available programs downloaded from a cloud of similar programs, including Google SketchUp, Earth, Maps, Docs, PickPic, KompoZer, VirtualDub, FastStone, PDF Fill, Scribus, and the Wink animator. 

For more details on all our books, visit our website at www.insitebuilders.com.  
.
.

Saturday, January 8, 2011

Virtualized Clouds in Construction

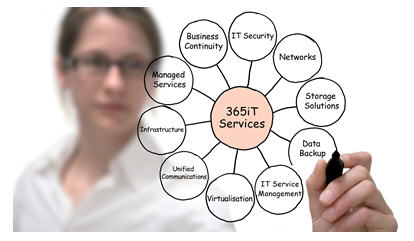
"Virtualization" became popular for desktop computers in 2007 as operating systems, memory, and data storage became more affordable.  By definition, virtualization is the creation of a virtual rather than actual version of something (Wikipedia). 
http://www.365itechnology.com/it-managed-solutions-managed-services/virtualisation-software.html

In practice, it’s a way of partitioning computer memory to set up distinct programs or data sectors on a hard-drive or network servers.  The idea is to organize information and software so it’s faster to access as stored memory, expanding the operational potential of different kinds of computational devices.

Virtualized interaction
The entire computational world has now been virtualized.  Today, internet resources, wireless networks, and the increased graphical capabilities of electronic devices continue to expand exponentially.

This means information is no longer stored on isolated standalone work stations, programming environments no longer operate from a single server, and many computers are no longer physically connected to a grid. 

The result is that users have been literally liberated from their desktops.
http://www.engadget.com/2010/04/07/notion-ink-adam-still-alive-working-on-flash-compatibility/

Instead, a cloud of resources, including thousands of constantly evolving applications, are now available wirelessly on networked devices that fit in the palm of your hand.  These little machines are highly mobile, require no mouse or keyboard, and display graphics, motion, and details in ways that are literally impossible to duplicate on ordinary computers.

Virtualized information
Even more important is the variety of open source resources available to these handheld displays.  This is best seen in the changing structure of how information is delivered across virtualized networks. 
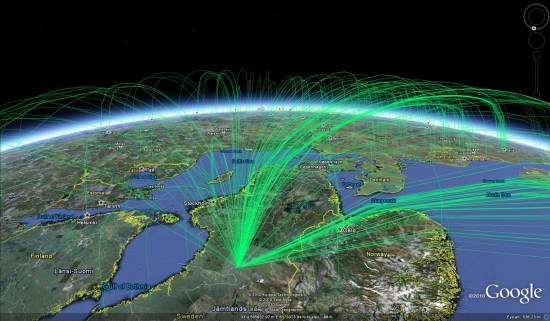
http://www.gearthblog.com/blog/archives/2010/12/wikileaks_around_the_world.html

For example, look at this posting on the Google Earth Blog.  It shows how far virtualized information has come.  First as a blog article that uses a single web page to explain a complex phenomenon with a simple display of graphical information; second as an animated introduction to the capability of one of the most stunning visual resources on the web (Google Earth); and finally, as a link to emerging virtualized environments that deliver information that behaves as if it has a life of its own (WikiLeaks).

Virtualized cloud
Cloud computing evolved from virtualization and exists as a byproduct of the internet.  It offers networked applications as construction tools that draw from the wealth of segmented information now stored anonymously on servers scattered around the world.

A cloud can be private or public.  Public clouds like Google, Wikipedia, and RSMeans are available to everybody.  This makes them available as common references accessible to an entire project team.  As such they help define the scope of work, motivations for project decisions, and research for alternative values.
http://www.constructiondigital.com/industry-focus/building-technologies/cloud-computing-and-construction

Structured clouds like Heavy Equipment 2, American Builders, Craig’s List or eBay are where contractors find and price tools, materials, equipment, and labor.  Construction resources are traded daily on these virtualized servers, often with links to detailed manufacturer information in the public sectors of private clouds.

Private clouds are networks or centers that offer proprietary information or software services.  Market oriented explanations are used to capture interested users, while subscribers pay a fee for deeper access and technical support. 

Examples include, Sage Construction, PrioSoft, and CMO Compliance.  The advantages of expert tools based in a private cloud include lower startup costs, transparency and mobility, training and technical support, access to a community of users, and continuous backup and software upgrades.

Virtualized advantages
In the end, design and construction companies are only as successful as their knowledge-base.  As such, the cloud works to the benefit of those that can comfortably access its potential, delivering innovative tools and immediate information to the fingertips of a new class of virtualized professionals. 

That’s a competitive advantage that’s as true for construction professionals, as it is for medical doctors, research scientists, and high school seniors. 

http://en.wikipedia.org/wiki/Sisyphus

As many small and large constructors work hard, struggling to maintain relevance in a quickly evolving economy, it doesn’t take much to see the advantage of such a compelling and flexible new resource. 

Virtualized Managers
In just a couple of years, the game has changed.  Work stations are now seen to be confining constructors to desktops, blocking the flow of clear project communications.  These cumbersome computers are becoming the aging anchors of an office-based technology that keeps team members from the face-to-face-on-the-jobsite interactions required for quick and efficient construction management. 
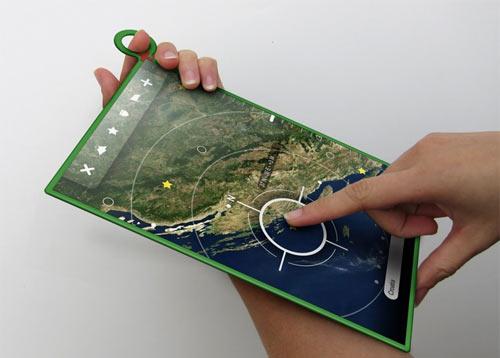
http://www.wired.com/gadgetlab/2010/05/negroponte-promises-75-olpc-slate-by-december/

It’s becoming fairly obvious that we are entering an era of flexible, highly mobile, communicative practices, backed by visual information displays, visible on a clipboard-sized touch pad tablet, wireless connected to a cloud.
.

Monday, December 6, 2010

Beyond 3D: Collaborative Displays

Eric Berlow gave a recent TED presentation on How Complexity Leads to Simplicity.  He used a series of visual images to define the interconnections of multidimensional objects as an active process.  The images were a dynamic form of visualization centered on the idea of stepping back and looking at the context of a problem in order to see the simplicity of separate groups of relationships.
http://core.ecu.edu/BIOL/luczkovichj/aers/aers_2005.html
Visualizing construction works in almost the same way.  The association of any particular part of the building is only really understandable when related to the whole.  For example, the installation of an electrical vault in a service area in a multistory building can appear complex.  In fact, the closer you look at the installation, the more complicated it becomes.  But step back and see the relationship of the vault to both the regional grid and the power network within the structure it serves and what was once a complicated object is “black boxed” into a simple self-contained unit, understood and managed by a subcontractor.  The installation is thereby simplified by its context in the total system.

Complexity is simplified by its relationship to the whole
Some saw this clearly in the movie Avatar.  Using techniques that revolutionized film and visual effects, John Cameron was able to quickly transfer the physical complexity of a strange new world with a holographic projection that was not only a basic three-dimensional model, but a visual index to the data or information associated with that model’s geography.

It’s not science fiction any more
Today, Zebra Imaging is well known for its cutting edge displays for visual communications.  Translating the files of otherwise ordinary 3D models, Zebra uses digital holographic prints to create realistic representations that set a new standard for three-dimensional depictions of complex relationships. 
http://www.zebraimaging.com
The company publishes these holograms for both commercial and military markets as a way to visualize information from point clouds, terrain models, and 3D construction models. 
http://vimeo.com/8078523
The prints are used to communicate the context of otherwise complicated processes by creating layers of visual data associated with different missions and projects that can act as the collaborative focus of team building and action oriented discussions on a jobsite – or battlefield.
A moving image is worth 10,000 words
Microbiologists use similar visual technologies to communicate the complexity of organisms that would be almost impossible for a scientist to explain without multidimensional models.  Borrowing from the game making industry, detailed animations bring complex structures to life in ways that graphically communicate how biological processes work in living organism.
 A particularly interesting example is The Whole Brain Catalog from the Center for Research in Biological Systems.  This is an open source, virtual catalog of the mouse brain that allows viewer to interact with contextual information based on a “cyberinfrastructure “of visualization software.

Collaborative 3D
What we see is a blueprint for delivering multidimensional information on the web.  This is a graphical communications system that goes well beyond antiquated two-dimensional drawings, straight into a brave new world where simple three-dimensional construction models are the basis for a deeper focus of any number of collaborative applications.  The ability to graphically describe mass and motion in ways where an entire team can participate in the discussion is drifting quickly into the mainstream of public perception.
http://www.zebraimaging.com
These examples hint at the rapidly developing visual tools and systems becoming available for construction.  Generations of constructors, struggling to leave their traditions of 2D construction drawings, are now being flooded by software innovations and an entirely new way of envisioning information while other companies and their clients embrace these new potentials.  
.
.